EHC ❯ Slow SelectableConcurrentHashMap#getRandomValues
-
Bug
-
Status: Closed
-
2 Major
-
Resolution: Fixed
-
ehcache-core
-
-
cdennis
-
Reporter: cedrik
-
May 02, 2012
-
1
-
Watchers: 14
-
June 18, 2015
-
May 21, 2013
Attachments
Description
While migrating one of our Hibernate application from OSCache to Ehcache, we noticed slow performance in SelectableConcurrentHashMap#getRandomValues. Profiler gives this stack trace as a (very) hot code:
net.sf.ehcache.store.chm.SelectableConcurrentHashMap.getRandomValues(SelectableConcurrentHashMap.java:84) net.sf.ehcache.store.MemoryStore.sampleElements(MemoryStore.java:629) net.sf.ehcache.store.MemoryStore.findEvictionCandidate(MemoryStore.java:614) net.sf.ehcache.store.MemoryStore.removeElementChosenByEvictionPolicy(MemoryStore.java:586) net.sf.ehcache.store.MemoryStore.checkCapacity(MemoryStore.java:569) net.sf.ehcache.store.MemoryStore.put(MemoryStore.java:262) net.sf.ehcache.store.FrontEndCacheTier.put(FrontEndCacheTier.java:257) net.sf.ehcache.Cache.putInternal(Cache.java:1489) net.sf.ehcache.Cache.put(Cache.java:1417) net.sf.ehcache.Cache.put(Cache.java:1382) net.sf.ehcache.hibernate.regions.EhcacheTransactionalDataRegion.put(EhcacheTransactionalDataRegion.java:134) net.sf.ehcache.hibernate.strategy.AbstractReadWriteEhcacheAccessStrategy.putFromLoad(AbstractReadWriteEhcacheAccessStrategy.java:93) net.sf.ehcache.hibernate.nonstop.NonstopAwareCollectionRegionAccessStrategy.putFromLoad(NonstopAwareCollectionRegionAccessStrategy.java:136) org.hibernate.engine.XXXX
Some of the Hibernate L2 cache region are way too small (~5-15% hit rate), so there is a lot of eviction going on. But it shouldn’t be slower than directly accessing the DB (which is the case right now)!
Our cache elements are configured like this:
<cache name="my.entity.or.collection.name"
		maxElementsInMemory="500"
		eternal="false"
		overflowToDisk="false"
		timeToIdleSeconds="28800"
		timeToLiveSeconds="86400"
		diskPersistent="false"
		memoryStoreEvictionPolicy="LRU"
		clearOnFlush="false"
		statistics="true"
	/>
Increasing the cache size is not really an option (our data size does not easily fit in memory).
Did I miss anything?
Thanks!
Comments
Karl von Randow 2012-05-20
Karl von Randow 2012-05-31
We have upgraded to 2.5.2 and I can confirm we still have this issue. No surprise as it is marked unresolved but I thought our issue may have been related to the deadlock error, but it appears to be the getRandomValues instead. Happy to test any proposed patches.
Gautam Jayaprakash 2012-06-25
Can you look at this one?
Himadri Singh 2012-07-04
I guess this is due eviction happening and not sure if we can do anything right now. They are not using BigMemory so probably we can move to different algorithm.
Will try to reproduce this without hibernate.
Himadri Singh 2012-09-18
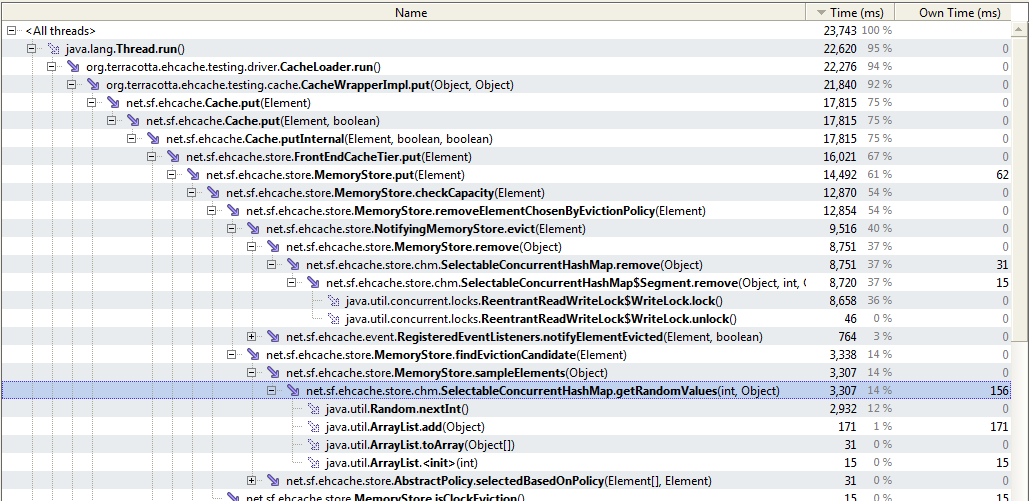
getRandomValues seems to be a hot point when we are evicting from inmemory store.
in thread dump inmemory-1.log, there were many threads at
"ParallelDriver-Thread-CacheLoader" prio=10 tid=0x00002aaab0161800 nid=0x5ed7 runnable [0x0000000045595000]
   java.lang.Thread.State: RUNNABLE
        at net.sf.ehcache.config.CacheConfiguration.getPinningConfiguration(CacheConfiguration.java:2555)
        at net.sf.ehcache.event.RegisteredEventListeners.internalNotifyElementEvicted(RegisteredEventListeners.java:257)
        at net.sf.ehcache.event.RegisteredEventListeners.notifyElementEvicted(RegisteredEventListeners.java:240)
        at net.sf.ehcache.store.NotifyingMemoryStore.evict(NotifyingMemoryStore.java:62)
        at net.sf.ehcache.store.MemoryStore.removeElementChosenByEvictionPolicy(MemoryStore.java:592)
        at net.sf.ehcache.store.MemoryStore.checkCapacity(MemoryStore.java:558)
        at net.sf.ehcache.store.MemoryStore.put(MemoryStore.java:258)
        at net.sf.ehcache.store.FrontEndCacheTier.put(FrontEndCacheTier.java:261)
        at net.sf.ehcache.Cache.putInternal(Cache.java:1459)
        at net.sf.ehcache.Cache.put(Cache.java:1387)
        at net.sf.ehcache.Cache.put(Cache.java:1352)
        at org.terracotta.ehcache.testing.cache.CacheWrapperImpl.put(CacheWrapperImpl.java:37)
        at org.terracotta.ehcache.testing.driver.CacheLoader.run(CacheLoader.java:153)
        at java.lang.Thread.run(Thread.java:662)
So inmemory-2.log is with the change in ehcache-core code.
Index: core/src/main/java/net/sf/ehcache/event/RegisteredEventListeners.java
===================================================================
--- core/src/main/java/net/sf/ehcache/event/RegisteredEventListeners.java	(revision 6293)
+++ core/src/main/java/net/sf/ehcache/event/RegisteredEventListeners.java	(working copy)
@@ -254,7 +254,8 @@
     }

     private void internalNotifyElementEvicted(Element element, ElementCreationCallback callback, boolean remoteEvent) {
-        if (cache.getCacheConfiguration().getPinningConfiguration() == null) {
+//        if (cache.getCacheConfiguration().getPinningConfiguration() == null) {
+	if(true){
             elementsEvictedCounter.incrementAndGet();
             if (hasCacheEventListeners()) {
                 for (ListenerWrapper listenerWrapper : cacheEventListeners) {
This thread dumps shows that there are lot of threads at
"ParallelDriver-Thread-CacheLoader" prio=10 tid=0x00002aaab036b000 nid=0x306a runnable [0x0000000042048000]
   java.lang.Thread.State: RUNNABLE
	at net.sf.ehcache.store.chm.SelectableConcurrentHashMap.getRandomValues(SelectableConcurrentHashMap.java:161)
	at net.sf.ehcache.store.MemoryStore.sampleElements(MemoryStore.java:618)
	at net.sf.ehcache.store.MemoryStore.findEvictionCandidate(MemoryStore.java:603)
	at net.sf.ehcache.store.MemoryStore.removeElementChosenByEvictionPolicy(MemoryStore.java:575)
	at net.sf.ehcache.store.MemoryStore.checkCapacity(MemoryStore.java:558)
	at net.sf.ehcache.store.MemoryStore.put(MemoryStore.java:258)
It seems like a hotspot. In-memory store is too fast, getting random elements slows it down a bit.
Himadri Singh 2012-09-18
For in-memory store, getting random entries is a hotspot and its easily reproducible in non-hibernate case too.
James House 2012-09-18
Chris, could you please assess what can be done, and LOE?
Chris Dennis 2012-09-18
After some discussion amongst the team there was a small opportunity for performance optimization here that I have fixed (r6301 in trunk). This should improve performance when a cache is configured with TTI/TTL. I don’t know what test case you were running Himadri so I don’t know if it will help you. If you think you are you could rerun those tests to see if there is a measurable improvement.
Chris Dennis 2012-09-18
Cedrik: In your use-case the low hit rate means the cache isn’t really going to be buying you anything. Since 85+% of the accesses miss the cache, all the cache is really doing is adding overhead to the DB accesses, by requiring you to put the retrieved value in to the cache. Assuming the load you are applying when you see these low hit rates is representative of your production workload then you are likely to be better off not having a cache at all - that is if you cannot make it significantly larger.
Karl: I can’t speak for your use case without more hard numbers - but if you’re seeing a hotspot in the eviction path as a problematic hotspot in your overall application then you are probably also suffering from a low hit rate too.
Himadri Singh 2012-09-18
I am running eternal caches without any TTI/TTL. Just adding capacity check on MemoryStore.
Himadri Singh 2012-09-18
Will run tests with latest code and update the numbers.
Himadri Singh 2012-09-20
With latest code, getRandomValues seems to be a hotspot but mainly due to usage Random.nextInt().
Yourkit profiler shows:
!randome.nextint.PNG!
Chris Dennis 2012-10-19
I’m pushing this out to Vicente. There are some more things we can do here - but they aren’t things I’m comfortable changing in a dot release this close to code freeze.
Cedrik LIME 2013-05-14
For reference, I can not reproduce this issue with Ehcache 2.5.7. I have another similar application using Ehcache 2.6.5 which is also not experiencing this issue.
I would thus be inclined to mark this bug as resolved. Karl, Himadri, what are your findings using those newer versions?
Karl von Randow 2013-05-21
I have not observed this issue in some time, whereas when it was occurring I was motivated to do frequent thread dumps to find out what was using so much CPU time.
I have just inspected one of our live servers that was suffering this issue and is currently under load and I’m pleased to report that there is not a SelectableConcurrentHashMap in sight. Therefore I concur, this appears to be resolved. Thank you.
Fiona OShea 2013-05-21
Resolving based on Cedrik and Karl’s comments. thank you for the feedback
Erik Tennant 2014-10-20
Hotspot and back trace view for SelectableConcurrentHashMap.,getRandomValues
Erik Tennant 2014-10-20
We recently discovered this same problem, using 2.9.0.
We are able to reproduce it through a series of performance tests. We have a cache of size 500,000 (in memory, no disk store) LFU.
We are poking and prodding right now, to get our heads around what is going on. I uploaded a couple of screenshots from visualVM that shows the method in question.
Erik Tennant 2014-10-20
To give an idea of the impact, this issue causes our application’s average response time to increase from 20ms to 1,000 - 2,000ms with outliers in the 10,000 - 15,000ms range
Chris Dennis 2014-10-21
Hi Erik,
I think it would be best if you filed a new issue for this. This issue is closed, and was filed against 2.5.1 not 2.9.0 - I’d like to try and keep them separate since we’re likely dealing with a different cause given that Cedrik and Karl reported this issue as fixed.
Paul Gifford 2015-06-18
Can somebody confirm exactly what version of EHCache this issue was fixed in?
We have also seen this in production with ehcache 2.5.1. We are upgrading to 2.5.2 and I will report back on whether we continue to see this issue.
We are not running with a profiler. The CPU usage of our Java process was very high, and a stack dump revealed a number (10+) threads with stack traces like this:
“ajp-bio-20001-exec-5422” daemon prio=10 tid=0x00007f036587d000 nid=0x3371 runnable [0x00007f0373bf8000] java.lang.Thread.State: RUNNABLE at net.sf.ehcache.store.chm.SelectableConcurrentHashMap.getRandomValues(SelectableConcurrentHashMap.java:84) at net.sf.ehcache.store.MemoryStore.sampleElements(MemoryStore.java:629) at net.sf.ehcache.store.MemoryStore.findEvictionCandidate(MemoryStore.java:614) at net.sf.ehcache.store.MemoryStore.removeElementChosenByEvictionPolicy(MemoryStore.java:586) at net.sf.ehcache.store.MemoryStore.checkCapacity(MemoryStore.java:569) at net.sf.ehcache.store.MemoryStore.put(MemoryStore.java:262) at net.sf.ehcache.store.FrontEndCacheTier.put(FrontEndCacheTier.java:257) at net.sf.ehcache.Cache.putInternal(Cache.java:1489) at net.sf.ehcache.Cache.put(Cache.java:1417) at net.sf.ehcache.Cache.put(Cache.java:1382) at net.sf.ehcache.hibernate.regions.EhcacheTransactionalDataRegion.put(EhcacheTransactionalDataRegion.java:134) at net.sf.ehcache.hibernate.strategy.AbstractReadWriteEhcacheAccessStrategy.putFromLoad(AbstractReadWriteEhcacheAccessStrategy.java:93) at net.sf.ehcache.hibernate.nonstop.NonstopAwareEntityRegionAccessStrategy.putFromLoad(NonstopAwareEntityRegionAccessStrategy.java:180) at org.hibernate.engine.TwoPhaseLoad.initializeEntity(TwoPhaseLoad.java:195) at org.hibernate.loader.Loader.initializeEntitiesAndCollections(Loader.java:982) at org.hibernate.loader.Loader.doQuery(Loader.java:857) at org.hibernate.loader.Loader.doQueryAndInitializeNonLazyCollections(Loader.java:274) at org.hibernate.loader.Loader.loadCollection(Loader.java:2166) at org.hibernate.loader.collection.CollectionLoader.initialize(CollectionLoader.java:62) at org.hibernate.persister.collection.AbstractCollectionPersister.initialize(AbstractCollectionPersister.java:627) at org.hibernate.event.def.DefaultInitializeCollectionEventListener.onInitializeCollection(DefaultInitializeCollectionEventListener.java:83) at org.hibernate.impl.SessionImpl.initializeCollection(SessionImpl.java:1863) at org.hibernate.collection.AbstractPersistentCollection.initialize(AbstractPersistentCollection.java:369) at org.hibernate.collection.AbstractPersistentCollection.read(AbstractPersistentCollection.java:111) at org.hibernate.collection.PersistentList.iterator(PersistentList.java:138) …
Note that this was also combined with what looked like the deadlocks fixed in 2.5.2 (https://jira.terracotta.org/jira/browse/EHC-942) so hence we’ll report back to see whether these were indeed related.